Get complete access to comprehensive company data for Sig India Trading Private Limited.
Complete Report
One-time • Full access
Credit Plan
Pay as you go • Instant

Processing your request...
Downloading your report...
Success
Request Company Screening
Sig India Trading Private Limited
Once your screening request is processed, you will receive a notification and the complete report will be available in PDF format for download from your account dashboard.
₹ 69.00 cr
₹ 69.00 cr
04 Oct 2023
31 Mar 2024
Sig India Trading Private Limited is an Indian private limited company incorporated on 04 Oct 2023. The company's registered office is situated in Mumbai, Maharashtra, India.
The current status of Sig India Trading Private Limited is Active. The company has filed its annual returns and financial statements up to 31 Mar 2024 (FY 2023-2024).
Sig India Trading Private Limited is a company limited by shares with an authorized capital of ₹69.00 cr and a paid-up capital of ₹69.00 cr as per the records maintained by the Ministry of Corporate Affairs (MCA).
Sig India Trading Private Limited has 3 directors and 1 signatories. The Key Managerial Personnel (KMP) at Sig India Trading Private Limited include Pooja Paresh Gondalia as Company Secretary. The directors of the company include Donakal Sreepathi, Mathew Felix, John Chul Lee.
The registered office of Sig India Trading Private Limited is located at 84, 8Th Floor, 3 North Avenue, Maker Maxity, Bandra Kurla Complex, Mumbai Maharashtra 400051 India in Mumbai, Maharashtra, India.
- CIN/LLPIN/FCRN: U66190MH2023FTC411465
- Legal Name: Sig India Trading Private Limited
- ROC Code: Roc Mumbai
- Company No.: 411465
- Company Category: Company Limited By Shares
- Company Sub Category: Subsidiary Of Company Incorporated Outside India
- Company Class: Private
- Listing Status: Unlisted
- Industry: Insurance And Pension Funding, Except Compulsory Social Security
- Date of AGM: 21 Aug 2024
🔒 14.3%
(FY 202_)🔒 8.9%
(FY 202_)🔒 12.7%
(FY 202_)🔒 9.5%
(FY 202_)🔒 11.8%
(FY 202_)🔒 15.2%
(FY 202_)🔒 10.6%
(FY 202_)🔒 13.4%
(FY 202_)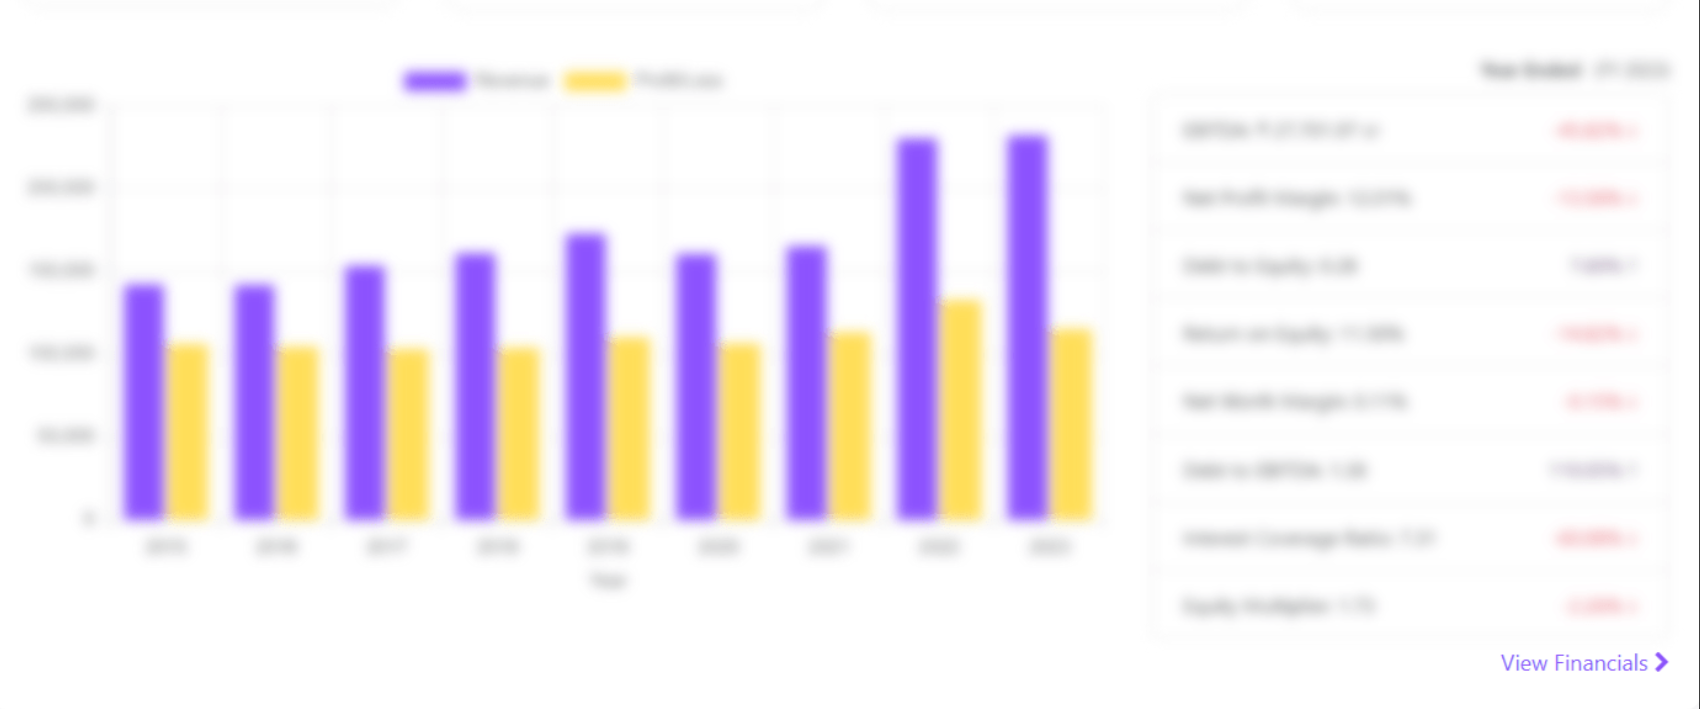
Financial Performance Overview
| Financial Metric | FY 2023 | Growth | FY 2022 | FY 2021 | FY 2020 | FY 2019 |
|---|---|---|---|---|---|---|
| Total Revenue | 12,45,67,890 | +191.42% | 4,26,78,123 | 3,89,45,234 | 2,98,12,456 | 2,15,67,890 |
| Revenue from Operations | 11,98,45,678 | +176.82% | 4,32,10,987 | 3,78,90,123 | 2,89,45,678 | 2,10,23,456 |
| Total Assets | 45,67,89,012 | +61.07% | 28,34,56,789 | 24,56,78,901 | 19,87,65,432 | 16,54,32,109 |
| Profit or Loss | -1,23,45,678 | 24.56% | 4,32,109 | 2,15,678 | 1,89,234 | 1,23,456 |
| Net Worth | 12,34,56,789 | 85.66% | 85,67,89,012 | 78,90,12,345 | 65,43,21,098 | 54,32,10,987 |
| EBITDA | 2,34,56,789 | +6604.87% | 3,49,012 | 2,10,987 | 1,56,789 | 98,765 |
| Past Director Details of Sig India Trading Private Limited |
|---|

Frequently Asked Questions
- donakal sreepathi
- john chul lee
- mathew felix
- pooja paresh gondalia